Lab: Atomic Emission Spectroscopy

Note for Teachers: Show the students several examples of emission spectra before asking them to record what they see. Seeing is not enough for most students since they do not understand what they are looking at. An emission spectrum is so far outside normal experience that without preparation students may not know how to even record what they do in fact see in using the spectroscope, diffraction grating, or CD.
For Reference:
Also, take a look at the PhET Java Applet Neon Lights & Other Discharge Lamps. Using this in overhead projection in the classroom may aid students in understanding what is going on.
Atomic Spectra Applet: http://astro.u-strasbg.fr/~koppen/discharge/discharge.html (this applet will not run on some systems anymore)

Objective

In this lab students will learn about atomic energy levels, atomic emission spectroscopy, and the spectral “fingerprints” of elements. Students will closely observe the spectrum of light produced by atomic emission gas discharge tubes using simple spectroscopes. They will record the spectra they observe.

Atomic.Emission.Process

Background

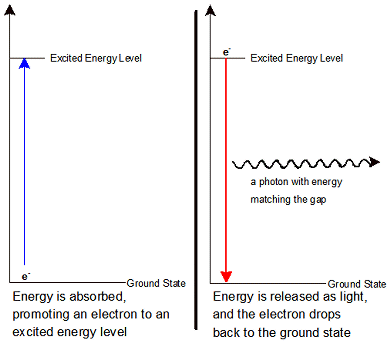
The electrons in an atom occupy different energy levels, as you know. When all of the electrons are at the lowest possible energy level they are said to be in the ground state. Electrons do not always stay in the ground state. Sometimes they can be promoted to a higher-energy electron shell. This can happen in two ways. First, the electron can absorb a photon of just the right amount of energy to move it from one quantum shell to another. Second, when atoms are heated or energized with electricity their electrons can gain energy. This promotes them to the higher-energy shell. When an electron is in a higher-energy shell it is said to be in an excited state.

Electrons in excited states do not usually stay in them for very long. When electrons lose their energy they do so by emitting a photon of light. Photons are particles with energy but no mass. Their energy is directly proportional to the frequency of the light (remember: E = hf). The photons emitted precisely match the quantum energy difference between the excited state and the ground state.

For different elements the spacing between the ground state and the higher energy levels is different. This gives rise to a way to uniquely identify elements based on their spectrum. A spectrum is the scientific name for a rainbow: light broken into the different wavelengths that make it up. You can see spectra using a spectroscope, a prism, or a diffraction grating. A spectroscope is a device which uses a diffraction grating to create a visual spectrum in a way that places the spectrum on a scale. This enables the user to measure the wavelengths of light being observed. The back of an ordinary CD is a reflective diffraction grating. Atoms produce very sharp lines in a spectrum when they are heated. You will look at these lines in this lab. These lines show the energy differences between different excited states and lower states, including the ground state. The atomic spectrum of hydrogen is shown below.
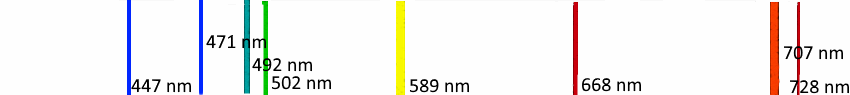
Emission_spectrum-H
H Emission Spectrum
Energy.Diagram.Blank (2K)

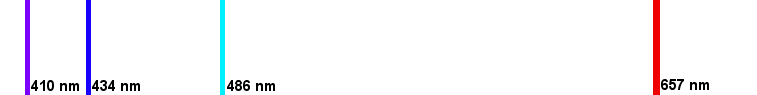
By recording the wavelength of each line it is possible to calculate the energy being emitted by the atoms of hydrogen in the tube. Each different amount of energy represents a different transition from a higher (excited) state to a lower state. For example, the transition of an electron in a hydrogen atom from the third level to the second produces a red line at 657 nm. When an electron moves from the fourth level to the second level in a hydrogen atom a photon with a wavelength of 486 nm is produced. The 434 nm line is produced by a transition from the fifth level to the second and the 410 nm line is produced when an electron moves from the sixth level to the second. A diagram of these energy levels in a hydrogen atom is shown at right.

Because every element has a unique spectrum the spectrum of an element can be used to identify it. Distant stars are too far away for us to take a sample to analyze in a lab. Even so, we can gather information about what they are made of by looking at the spectrum of light they produce. By collecting data here on Earth for every element we can record their spectral “fingerprints”. These can be used to identify them in far off stars and galaxies.


page break

Materials

  1. at least 5 atomic emission tubes with power supplies
  2. diffraction gratings, and/or spectroscopes
  3. paper & colored pencils
  4. Spectrum Data Sheet

Safety

Procedure

Read all instructions completely before beginning your work in the lab. Remember to record your observations in your lab notebook or on a piece of paper in your binder before you leave class.

Color Representative
Wavelength (nm)
Wavelength
Region (nm)
Violet 420 400 - 440
Blue 455 440 - 470
Blue-green 480 470 - 490
Green 525 490 - 560
Yellow-green 565 560 - 570
Yellow 580 570 - 585
Orange 620 585 - 630
Red 660 630 - 700

Observing Atomic Emission Spectra

  1. Obtain a copy of the atomic emission spectra worksheet. You will use this to record your lab data.
  2. Near the top of the page write the title: Atomic Emission Spectra. Also write your name.
  3. Your copy may not be in color. Using the chart at right, color the reference spectrum at the top of the page so that you will have a complete visible spectrum in color with which to compare the line spectra of the elements you will examine.
  4. Obtain a diffraction grating and a spectroscope. Either of these devices will split the light produced by the elements in the tubes into a spectrum you can see and both have their advantages and disadvantages. The spectroscope will make it easier to assign numerical values to the wavelengths of the light. The diffraction grating will make it easier to differentiate closely spaced lines.
  5. Observe the spectra of all available elements. The spectrum tubes are delicate and must be used properly in order to ensure that they have as long a useful life as possible. To prolong their usefulness please operate them by cycling them on and off for 30 - 60 seconds at a time. Turn the lamps on for 30 - 60 seconds and off for 30 seconds.
  6. Record the unique atomic emission spectrum of each of the different elements in one of the rectangles on your Atomic Emission Spectra page. Label each spectrum carefully! Be as careful as you can to place the lines of the spectrum as close as possible to the correct numerical value for the wavelength. Use the color spectrum at the top of the page to line up the lines as best you as can so that you can estimate the wavelength of the lines you draw. The lines need not be in color, unless you wish them to be.
  7. Once you have roughly recorded the spectra of all the spectrum tubes available take another look at the hydrogen tube. A reference spectrum is shown below. Looking at the spectrum of the tube, compare what you see to the reference spectrum. Use the reference to refine your record of the hydrogen spectrum. Record any lines you see that are not on the reference and note whether there are lines on the reference that you cannot see. You will be using the data you collect here to create an atomic energy level diagram for hydrogen.
    Emission_spectrum-H
  8. Once you have roughly recorded the spectra of all the spectrum tubes available take another look at the helium tube. A reference spectrum is shown below. Looking at the spectrum of the tube, compare what you see to the reference spectrum. Use the reference to refine your record of the helium spectrum. Record any lines you see that are not on the reference and note whether there are lines on the reference that you cannot see. You will be using the data you collect here to create an atomic energy level diagram for helium.
    Emission_spectrum-He


page break
 

Grading

For this activity you must turn in the following items:

  1. Your Atomic Emission Spectra
  2. Answers to the following questions in a neatly typed document. (One question requires a drawing. Do this neatly on paper and scan or take a photo to paste into your document.)

Questions

  1. What is a spectroscope and what is it for? Remember, you used a spectroscope in this lab.
  2. Hot solid or liquid objects emit light at all wavelengths of the visible spectrum, if they are hot enough. The isolated atoms in the thin gas inside the spectrum tube were given a very large jolt of energy but only glowed at specific wavelengths. What is happening within the atoms that causes them to emit light in specific lines in a spectrum?
  3. What is the connection between a line in an atomic emission spectrum and the difference in energy between two energy levels in an atom?
  4. Each tube contained a different material and each produced a unique spectrum of specific lines. Why did each of the different tubes have a different emission spectrum? Explain your answer in terms of the energy levels within atoms of different elements.
  5. The emission spectrum of each element is unique. Astronomers studying the stars collect information about their brightness and the spectrum of light produced by them. These distant stars are too far away to sample physically and yet astronomers are certain that they are made of the same elements as we find here on earth. How can they be so sure?
  6. Create a data table to record the carefully collected data you have for the spectra of helium and hydrogen. In the table record the information as in the example below. Put your results in order from smallest to largest energy per photon.
    Wavelength (nm) Wavelength (m) Frequency (Hz) Energy per Photon (J)
           
  7. Energy.Diagram.Blank (2K) Consider the example energy level diagram at right, which is based on the energy levels of the hydrogen atom. The height of each line represents the difference in energy between a level and the ground state, or level 1. Create your own diagrams for hydrogen and helium. Assume that all of the spectral lines that you recorded represent an electron falling from some higher level down to just one level. This may be either level 1 or level 2. Assign each spectral line to one specific jump between a higher level and a lower level. On your diagram show the motion of an electron from a higher level to a lower level and match that motion to one of the spectral lines in the hydrogen spectrum or the helium spectrum. Remember that larger amounts of energy are shown on these diagrams by larger jumps between levels. Hint: in the introduction there is a detailed description of how the lines in the hydrogen spectrum relate to specific transitions between higher and lower energy levels.
  8. In your own words, write a short explanation using two or more complete sentences of how an electron absorbs energy and re-emits it as light .


Pre-lab Questions for this Lab
Data Collection Sheet for this Lab
Flame Tests Lab (Fireworks)
Last updated: Apr 03, 2019       Home